Education and Training
Tools and Services
Resources
Communication

We are working on a DSL2 implementation using the nf-core tools on separate branches. Based on some differences in focus we don't currently anticipate combining this with the nf-core ampliseq workflow, though we may revisit this in the future. In the meantime: We will continue to address critical bugs on this branch, but the majority of effort will be in converting the workflow to DSL2
A dada2-based workflow using the Nextflow workflow manager for Targeted Amplicon Diversity Analysis.
Read more at TADA
The African microbiome portal (AMP) is in development under H3Africa initiative to provide a centralized repository for microbiome metadata associated with African populations, with following aims:

Modern computing has enabled research that was previously considered unfeasible. Parallel algorithms have been developed to run over powerful multicore machines. For even more computing power, these machines can be aggregated together into large high performance computing (HPC) clusters. On these clusters, jobs can be spread out across a large number of nodes instead of being executed on a single machine. This can substantially decrease the time required to execute resource intensive modeling and simulation jobs – a common requirement in the field of biophysics. It is also useful when a large number of much smaller jobs need to be executed. Unfortunately, running jobs on a cluster involves a steep learning curve. Jobs must be submitted via software systems known as resource managers. These systems can usually only be run via the command line and require expertise that most researchers don't have.
To solve this problem, we have developed JMS, a web-based front-end to an HPC cluster. JMS allows users to run, manage and monitor jobs via a user-friendly web interface. It also lets users create new tools that can be pipelined together along with existing tools to create complex computational workflows. These workflows can be saved, versioned and reused as needed. A detailed job history of all jobs is stored and can be accessed and download at any time. All tools, workflows and jobs can be shared with other users to create a highly collaborative work environment. In addition, tools and workflows can be made public via external interfaces. Although applicable to any field, JMS is currently being tailored toward structural bioinformatics with the introduction of tools and workflows for homology modelling, docking studies, and molecular dynamics.
JMS has been open-sourced and is freely available at https://github.com/RUBi-ZA/JMS.
JMS has been published in PLoS ONE:
David K Brown, David L Penkler, Thommas M Musyoka, and Özlem Tastan Bishop "JMS: An open source workflow management system and web-based cluster front-end for high performance computing" PLoS ONE 10(8): e0134273, 2015. doi: 10.1371/journal.pone.0134273
An insight into genome-wide nucleosome positions is required to understand the local regulation of genome function. Bioinformatics tools to analyse nucleosome positions in genomes are limited. This paucity is addressed with NUCPOS, a suite that provides several utilities to analyse important aspects of nucleosomal organisation, including nucleosome density, the positioning strength of individual nucleosomes, the contribution of sequence to observed positions, and the average nucleosomal organization of specified genomic positions, such as pol II transcription start sites.
NUCPOS is available under the GNU public license (GPL-3). The C++ 11 source code may be downloaded from https://sourceforge.net/projects/nucpos/ and compiled with GCC (gcc.gnu.org) g++ version 4.7.3 or later.
Nucfrag: takes the SAM format (samtools.github.io/hts-specs/SAMv1.pdf) output file without headers generated by Bowtie2 (bowtie-bio.sourceforge.net) as input, and generates a series of data files of the number of nucleosomes centred at each base pair position of each chromosome. Nucfrag allows the selection of lower and upper fragment sizes to select subpopulations of nucleosomes, possibly with or without associated linker histone H1, from the bowtie2 output file. Additional outputs include a file of the distribution of the aligned fragment sizes in the selected size range, and data files of virtual footprints, simulating genomic areas that would be protected from nuclease cleavage by nucleosomes. The nucleosome position data files can be uploaded and viewed in a genome browser after addition of the appropriate BED or bigBed format headers (genome.ucsc.edu).
Dyad_bins: is a program that takes the nucleosome position data files generated by Nucfrag as input, and performs a binning analysis, i.e., it counts the number of times that a specific number of nucleosomes are co-aligned in the genome. The output can simply be visualized with a graphing program such as Gnuplot (www.gnuplot.info). The co-alignment of many nucleosomes at a specific genomic position generally indicates a strongly positioned nucleosome, which may have functional relevance. This analysis provides insight into the general nucleosome density and number of well-positioned nucleosomes in specified genomic regions (Fig. 1 A).
Align_dyads: is a program that takes a text file with a list of genomic positions and the nucleosome position data files generated by Nucfrag as input, and generates a data file of superimposed nucleosome positions aligned at the specified genomic positions. The user can select the number of nucleotides to include upstream and downstream of the listed positions. The program is especially useful to gain insight into the average nucleosomal organization of transcription start sites, defined replication origins, and similar functional elements in a genome. An output file is written than can be visualized in Gnuplot (Fig. 1 B).
The precise rotational and translational position of a nucleosome is determined by the DNA sequence accommodated by the nucleosome, as well as steric influences due to other proteins bound to the DNA. The contribution of intrinsic sequence effects is often useful to understand whether specific, functionally significant, well-positioned nucleosomes are precisely placed due to the inherent DNA sequence, or due other features of the genome. The utility hp_fft allows the user to quantitatively access the contribution of dinucleotide periodicities to the anisotropic flexibility of nucleosomes positioned at identified genomic positions (Fig. 1 C).
hp_fft: performs the fast Fourier transform of the distribution of each of the 16 possible dinucleotides in a sliding 128 nt window, and provides the Fourier magnitude of the distribution of each dinucleotide at a periodicity of approximately 10 nt. hp_fft takes as input the fractional occurrence of each dinucleotide at each sequence position in the sequence of interest. The factional distribution is generated with the utility dinucleotide_frequencies, which takes as input the FastA format sequence file, which may contain multiple sequences representing nucleosomes positioned at specific genomic features. hp_fft requires the open source FFTW library (www.fftw.org).
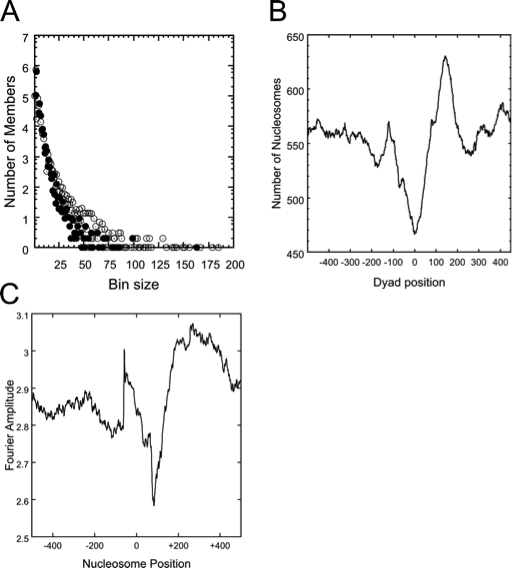
Fig. 1. (A) Distribution of co-aligned nucleosomes into bins. Nucleosomes present on coding regions (filled circles) and on non-coding regions (white circles) are shown. (B) The average nucleosomal occupancy of a polyadenylation site. Note the nucleosome depleted region at position 0, and the strongly positioned nucleosome at position 150. (C) Fourier amplitude of a genomic region. Dinucleotide distributions that could support well-positioned nucleosomes are present at positions 50 and the region 200-400. All images were generated from NUCPOS output files with Gnuplot.
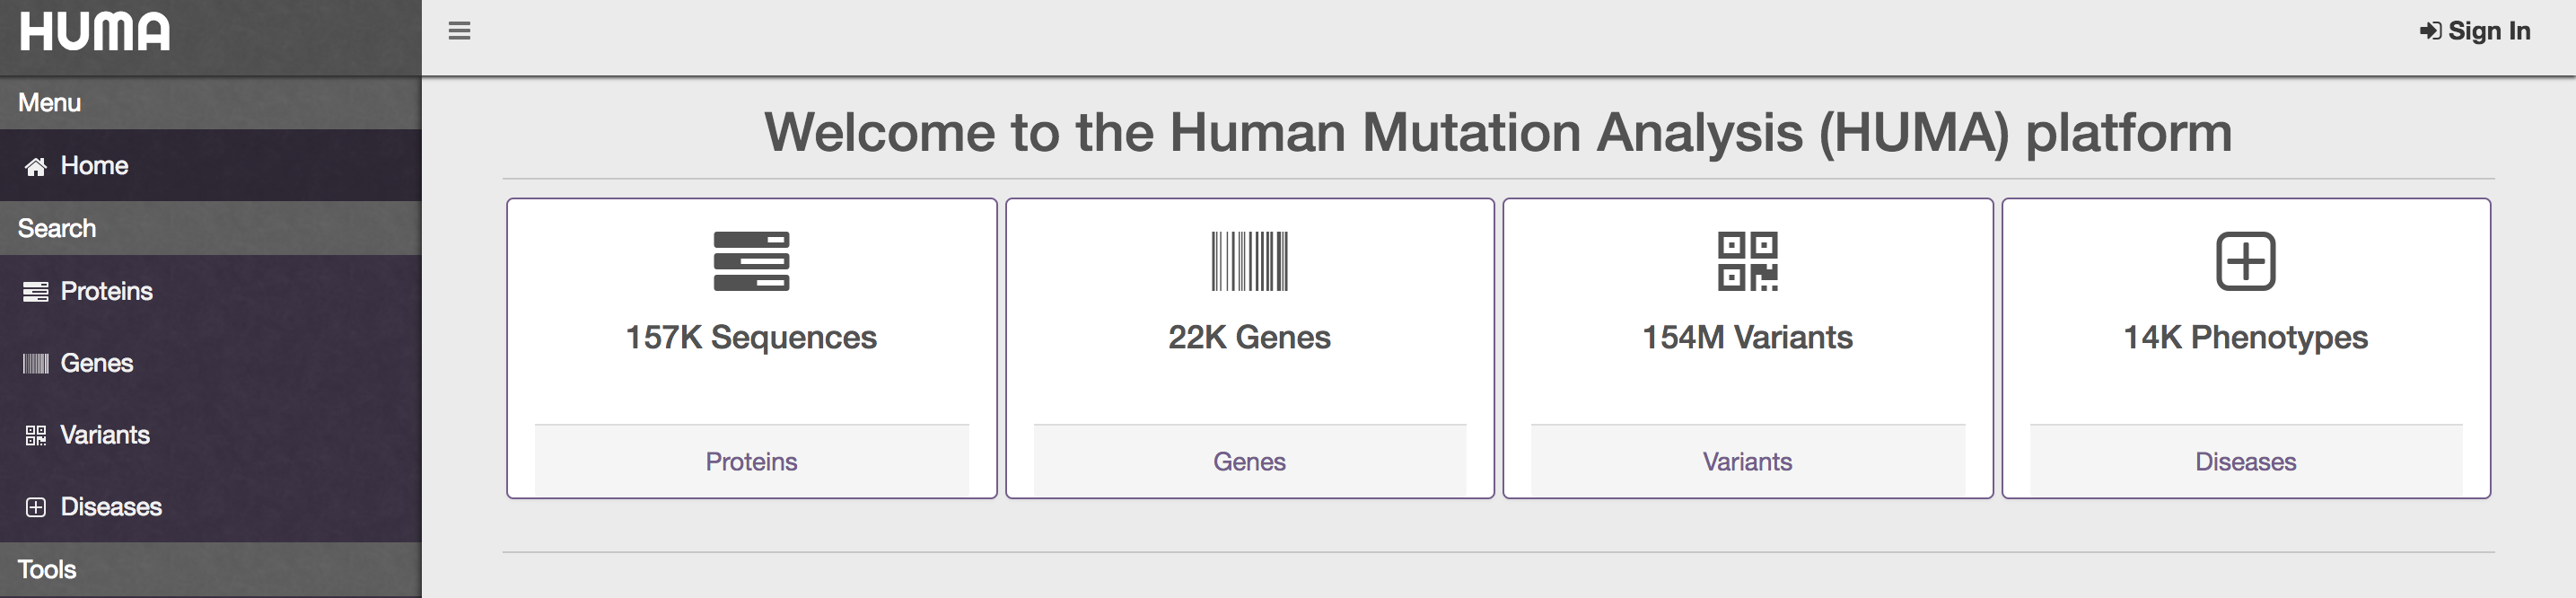
The Human Mutation Analysis (HUMA) web server has been developed as a freely available platform for the analysis of genetic variation in humans. HUMA provides an extensive database, populated from a myriad of different sources, and incorporates a number of tools to analyse and visualize the data. The HUMA database is populated with genes, transcripts, exons, proteins and protein structures, diseases and variations. All data has been linked to allow advanced search functionality. For example, searching for a protein will provided all related data including the genes that code it, the known SNPs and other variations within it, the diseases associated with it, and all the experimentally determined PDB structures.
The HUMA database has been created with the aim of analysing the effects on non-synonymous SNPs on protein stability and function. In order to do this, analysis tools needed to be incorporated into the web server. Firstly, a BLAST tool has been incorporated to allow users to search the HUMA database for homologous proteins. Secondly, a homology modelling pipeline has been included to allow users to model proteins with variations from the database included. In addition, tools, such as Polyphen 2.0 and nsSNPAnalyzer, that try to predict the effects of variations, will also be made available via the web interface.
Collaboration features have been built into HUMA to facilitate the sharing of job results and analysis. HUMA also allows users to upload their own variation data to the server. These datasets are stored privately and users can choose to share them with other users and groups.
Once launched, the HUMA web server will be freely available at https://huma.rubi.ru.ac.za
All articles on upcoming webinars
Tools and Services
Resources
Communication